The National Association of Active Investment Managers (NAAIM) conducts a survey of its members and reports the average U.S. equity exposure among the group.
This survey has been a great contrary indicator in the past. Collectively, professional managers are terrible allocators. Individual investors are too. As a group, they tend to be too heavily weighted into stocks near highs and not have nearly enough exposure on when stocks are bottoming.
Recently, the market took a dive, and investors for the first time in years were rudely reminded that stocks sometimes do go down! As a result, more than a few people got scared.
Below is a chart of the exposure courtesy of NAAIM.
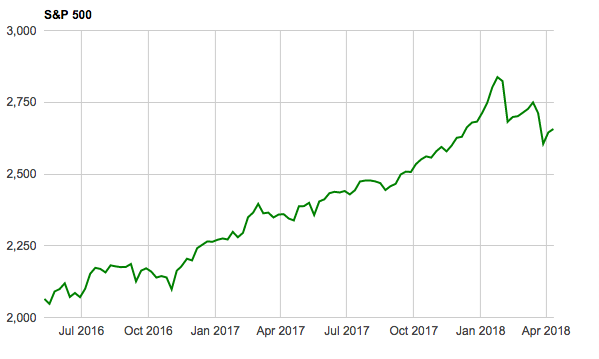
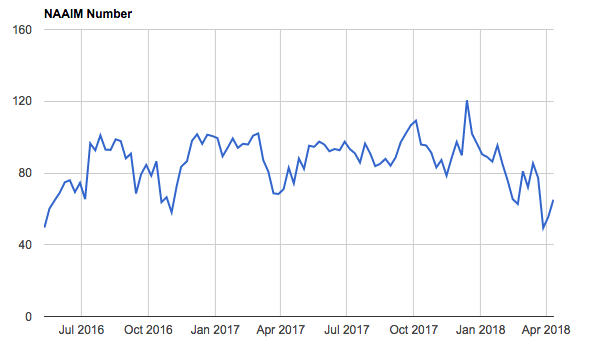
As you can see, as the market was rocketing higher, so was the exposure. But, the dips in February and March brought down the exposure dramatically from 120% in December, 2017 to under 50% in March, 2018.
What a move!
This is a good contrary indicator. Under normal circumstances a short-term bottom may be in. However, we have been operating in anything but normal circumstances. In the 50% range, the average annual returns are about 7.5%. That’s good but not great. We want to see something under 25% when the returns more than double current expectations.
It’s also important to remember than valuations are stretched as well. And, we are entering earnings season so anything can happen with individual stocks as they report their quarterly results.
While sentiment has become more reasonable, we still have a bit to go before backing up the truck and buying stock. Let’s wait and see where the next dip takes us.