Stock Market Bulls Trigger a Selling Signal.
We are appreciative to our friends at SentimenTader.com for the following Chart of the Week post:
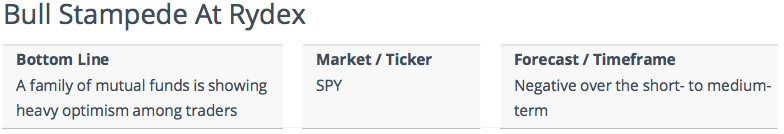
Stock Market Bulls Trigger a Selling Signal. It’s not hip to be a mutual fund manager anymore – all the cool kids are rushing into ETFs. Even so, the Rydex family of mutual funds still holds more than $4 billion in assets, and it remains popular with fund timers.
It was way ahead of the curve in releasing the asset levels of their funds. Because their client base actively traded, it became a very useful set of indicators, then interesting-but-less-useful as they became more popular and the asset base dwindled. Some of the funds now are beholden to one or a few large traders, which can swing the asset levels wildly from day to day.
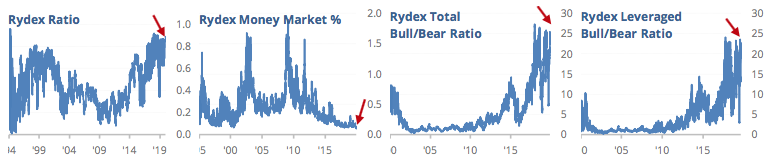
Even so, the past few sessions have recorded notable extremes. There is a record low percentage of money stashed in the safety of the money market, the original Rydex Ratio is nearing an all-time high, the Total Bull/Bear Ratio (with funds introduced in February 2000) recently neared an all-time high, and the Leveraged Bull/Bear Ratio (with funds introduced later in 2000) recently hit the 2nd-highest level ever, next to a day in January 2018.
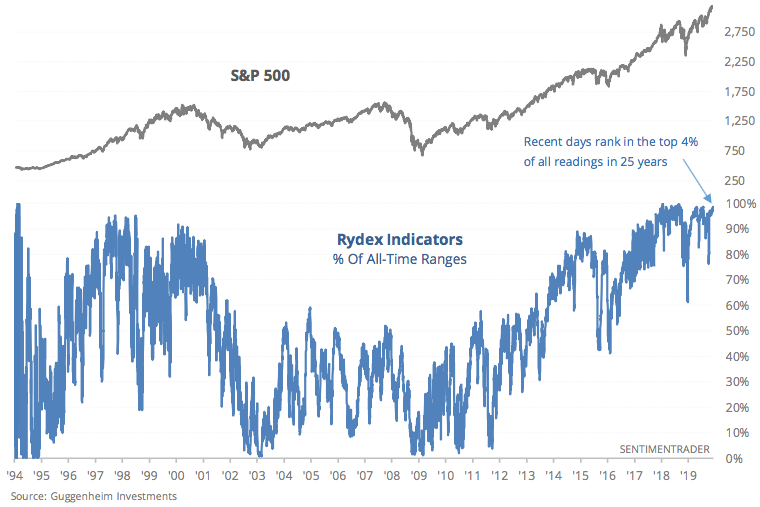
If we look at each of those four indicators relative to their all-time ranges, we’re at a true extreme. For the money market fund, we use an inverse ratio to approximate optimism.
Rydex mutual fund traders have almost never been more bullish.
Looking at the individual ratios, we can see just how extreme they’ve been.
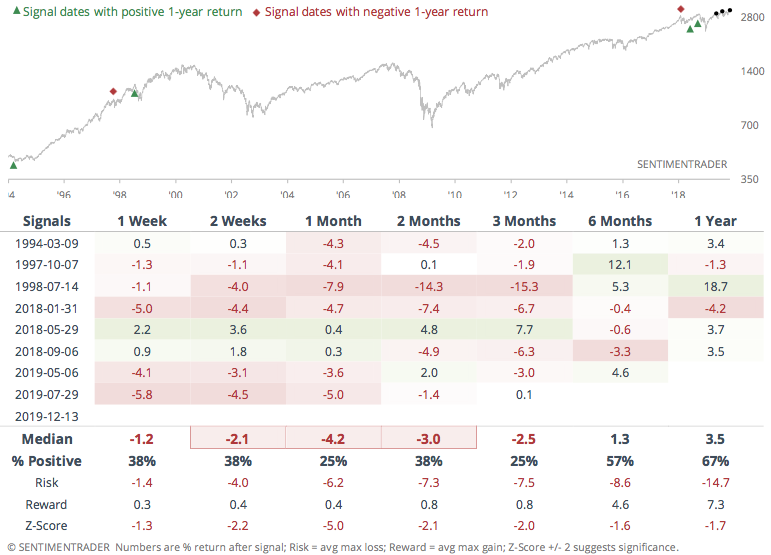
In aggregate, when they peak at an extreme level, stocks have struggled.
S&P 500 after Rydex indicators peak in top 5% of ranges (1994-2019)
Because of the influence of a handful of traders on the data, we pay much less attention to these flows than we did 10 or 15 years ago. Still, they can be useful once in a while when they reach true extremes, and that’s where they’re at now.
See More Chart of the Week Posts: