This Indicator is Flashing Warning Bells for the Market
By John Del Vecchio
The New York Stock Exchange (NYSE) Bullish Percent index is creating a potential bearish divergence with the S&P 500. This could be suggesting a lot of weakness under the hood of the market.
The bullish percent is the percentage of stocks in bullish patterns using point and figure charting. Point and figure charting has been around since before 1900 and is a simple chart showing price movement (X’s for up and O’s for down). It makes it easy to see trends in the prices of stocks. In addition, stocks are either on a “buy” or a “sell” so the analysis could not be clearer.
The beauty of the NYSE Bullish Percent is that is shows stocks moving up and down in the aggregate. Importantly, each stock gets a single vote. This differs from the S&P 500 because the S&P is market capitalization weighted. So, a stock like Apple gets significantly more weight than Waste Management. The top 5 stocks in the S&P 500 are 12-15% of the total index. In the NYSE Bullish Percent, they are all the same.
Most people use the S&P 500 when they talk about “the market”. But, what’s going on in the market could be quite a bit different than what is going on with the typical stock. We can see this in the chart below.
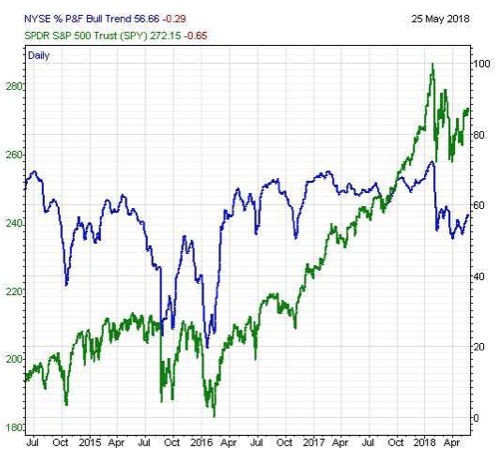
The green line is the S&P 500. The blue line is the NYSE Bullish Percent. Prior to the butt kicking the S&P took in February, both of these lines mostly moved in tandem. The S&P made new highs as did the bullish percent.
But, recently that relationship has weakened. The S&P 500 has rebounded and is close again to new highs. Small cap indexes hit new highs recently as well. However, the bullish percent figures are lagging. The one stock, one vote nature of the index is letting you know that not as many issues are participating in the rise of “the market.”
You might see this in your own portfolio. The market may be making new highs but your holdings are lagging. In healthy markets, we expect to see lots of stocks making new highs. At the very least, we would like to see them back into uptrends.
That’s not happening.
The danger here is that by the time the S&P 500 rolls over, the average stock could be down 10-20%. This is useful gauge to monitor the health of the market in aggregate.
Right now, it is sending off some warning bells that things are not as strong as they appear to be.