What is one of NDR’s most popular indicators saying?
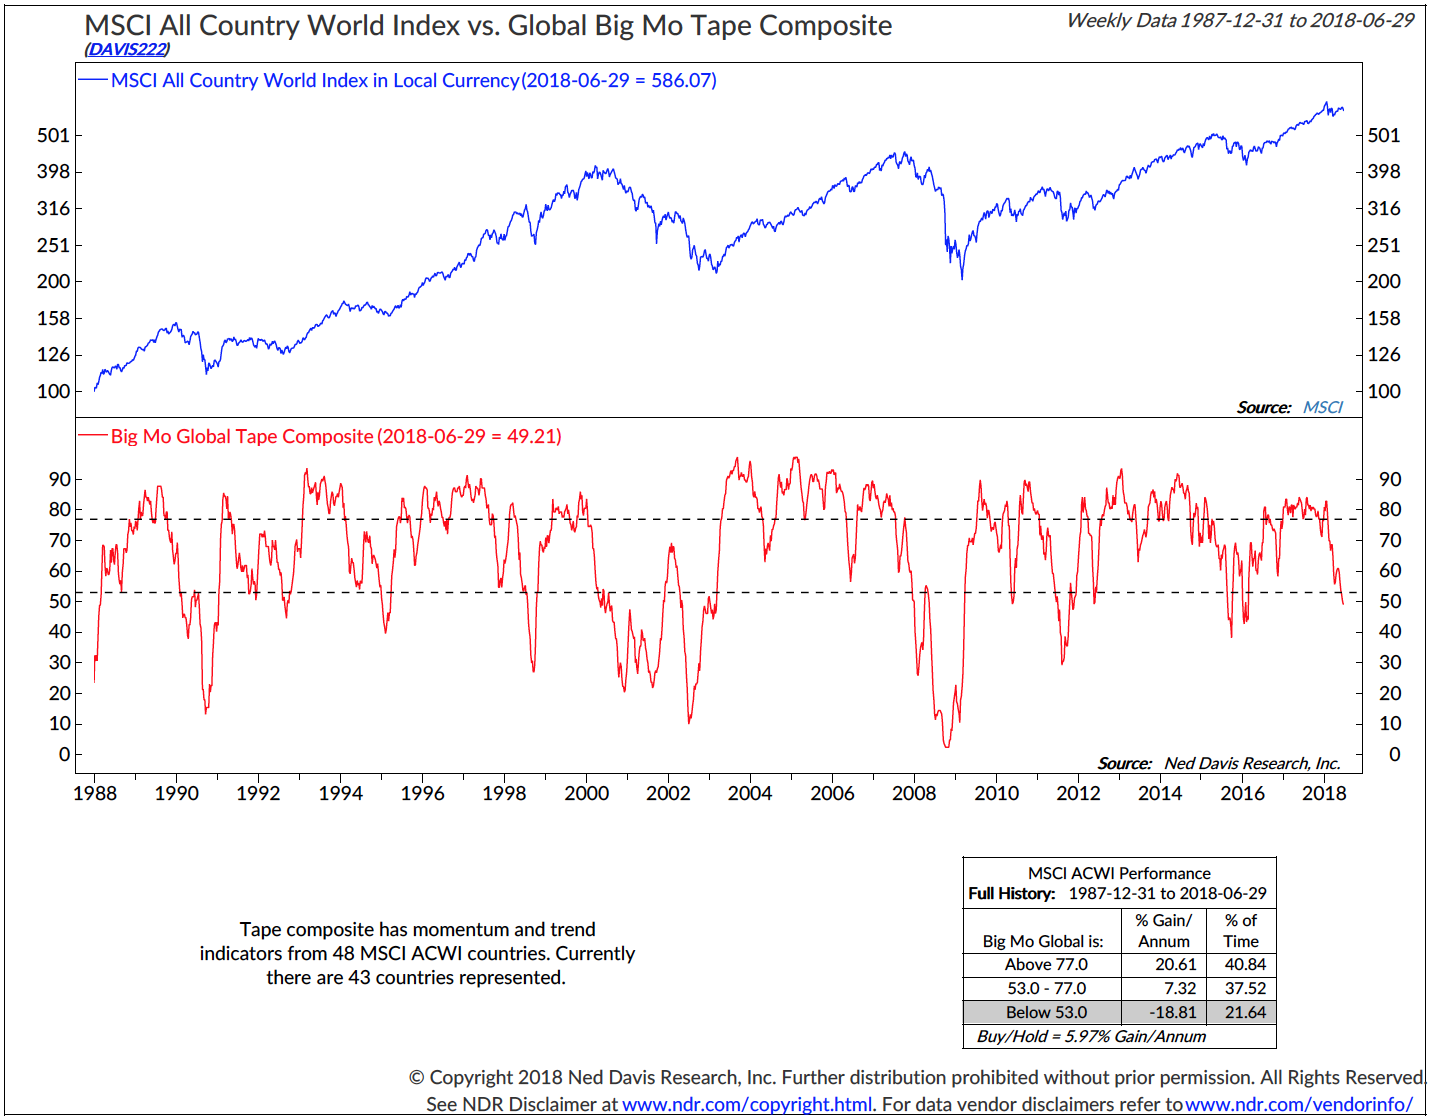
BIG MO MULTI-CAP MSCI TAPE COMPOSITE
Big MO, is one of NDR’s most well know indicators. We thought it interesting to show that it is in a full sell signal for the Euro exchanges.
I encourage you to read the definition below and study the chart closely. This could lead to trouble in the US markets.
The NDR Big Mo Multi-Cap Tape Composite Model was created to give a composite reading on the technical health of the broad equity market. The model, plotted in the lower clip of the chart, aggregates the signals of over 100 component indicators and generates a reading between 0% and 100%, reflecting the percentage of the component indicators which are currently giving bullish signals for the S&P 500 Index. The chart’s top clip plots the S&P 500’s weekly closes.
The model uses trend and momentum indicators based on a broad array of our NDR Multi-Cap cap-weighted sub-industry group price indices. Trend indicators are based on the direction of a sub-industry’s moving average, while the momentum indicators are based on the rate of change of the sub-industry’s price index. By including many indicators together in the composite model, we find the “weight of the evidence” regarding the market’s trend and momentum rather than relying on only one or a few indicators. The specific signal-generation calculations for the model’s indicators were determined based on historical testing.
The boxes in the chart’s upper clip show two perspectives on how the S&P 500’s returns have historically been associated with the model’s readings. One box shows the market’s returns based simply on what range the model’s weekly reading falls in (high readings are bullish, low readings bearish), while the other two boxes together show how the market’s returns have varied based on both the level and the direction of the model readings. We have found that whether the model is improving (rising) or weakening (falling) can give valuable information in addition to the model’s current level: when Big Mo Tape has been high and rising, the returns have tended to be best, while a low and falling model reading has been associated with the weakest returns. And while the model was built based on the S&P 500 (a cap-weighted index of primarily large company stocks), we also found that it provides good results when using the broad, equal-weighted Value Line Geometric Index.
This model provides a single summary reading of the U.S. stock market’s technical health based on historical analysis of many trend and momentum indicators. Because one of NDR’s primary tenets is “Don’t Fight The Tape”, we use this trend-based model as a key element in our market outlook and strategy, and consequently it is used as a component of other NDR models as well.
This version of Big Mo uses our re-designed Sector work that adheres strictly to the S&P/MSCI Global Industry Classification System (GICS).
Brad Lamensdorf